

Plotting scientific graphs is essential for all researchers who want to present their findings in a meaningful way. Many free software tools for data analysis and scientific graph drawing are available in the market. To find the best software, ilovephd presents the 5 best graph plotting and data analysis tools for thesis and research article writing in this article.
Data Analysis and Graph Plotting Software for Thesis
1. OriginLab
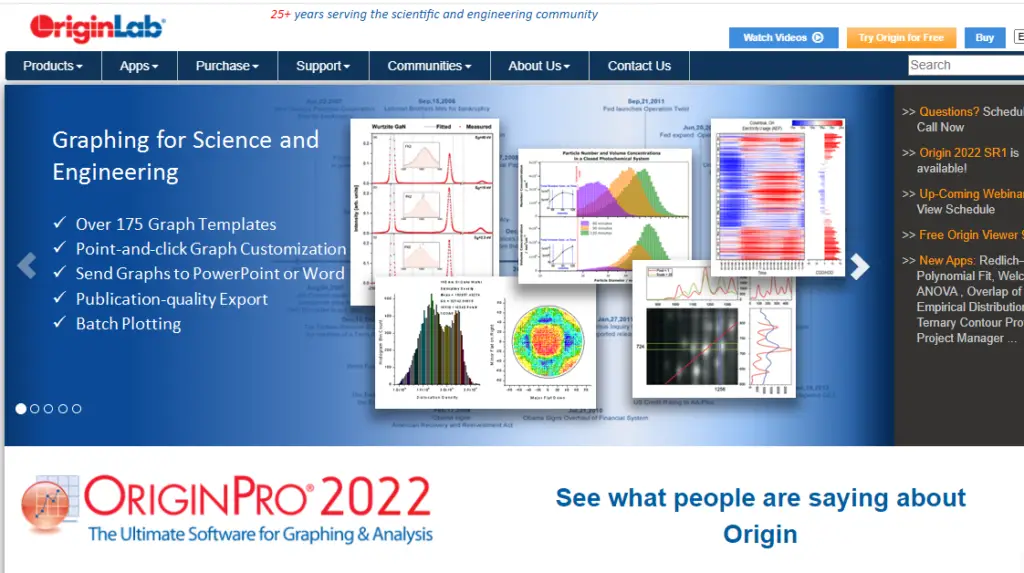
OriginLab publishes graphing and data analysis software. It provides a comprehensive solution for scientists and engineers who need to analyze, graph, and professionally present data.
Origin has been growing in popularity among scientists and engineers since 1992. Origin is available in English, German and Japanese and is used in a wide array of corporations, government agencies, colleges, and universities worldwide.
Along with its easy-to-use graphical interface, Origin offers intuitive, yet powerful, tools for the daily needs of the researcher. Origin’s point-and-click interfaces allow you to start using it right out of the box, yet its wide range of advanced features will provide for researchers’ growing needs.
2. Matplotlib
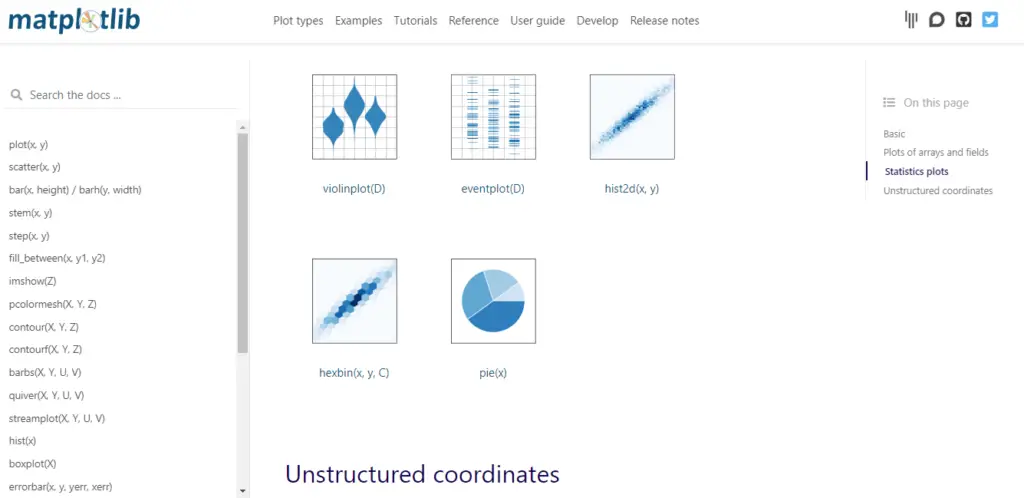
Matplotlib is a comprehensive library for creating static, animated, and interactive visualizations in Python. Matplotlib makes easy things easy and hard things possible.
- Create publication quality plots.
- Make interactive figures that can zoom, pan, update.
- Customize visual style and layout.
- Export to many file formats .
- Embed in JupyterLab and Graphical User Interfaces.
- Use a rich array of third-party packages built on Matplotlib.
3. gnuplot
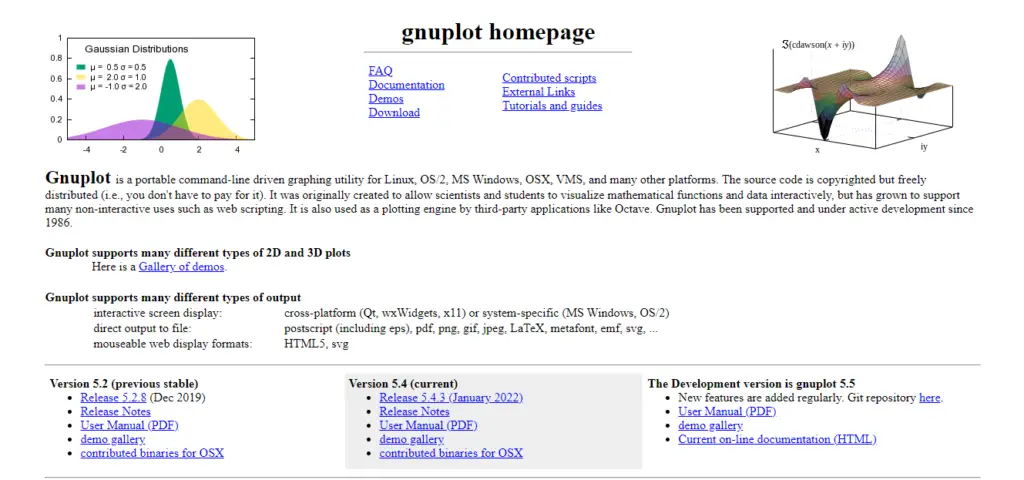
Gnuplot is a portable command-line-driven graphing utility for Linux, OS/2, MS Windows, OSX, VMS, and many other platforms.
The source code is copyrighted but freely distributed (i.e., you don’t have to pay for it).
It was originally created to allow scientists and students to visualize mathematical functions and data interactively but has grown to support many non-interactive uses such as web scripting.
It is also used as a plotting engine by third-party applications like Octave.
FEATURE HIGHLIGHTS:
| Interactive screen display: | cross-platform (Qt, wxWidgets, x11) or system-specific (MS Windows, OS/2) |
| Direct output to file: | postscript (including eps), pdf, png, gif, jpeg, LaTeX, metafont, emf, svg, … |
| Mouseable web display formats: | HTML5, svg |
4. LabPlot
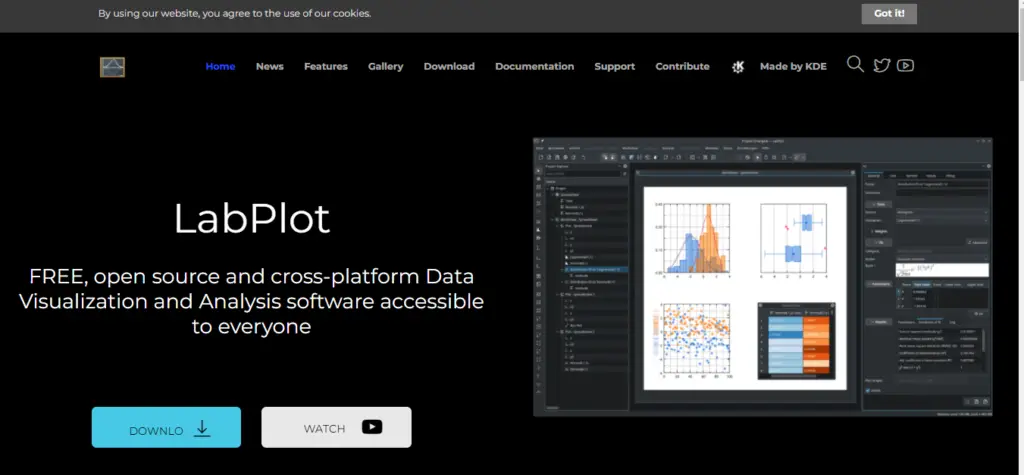
LabPlot is a free, open-source, and cross-platform Data Visualization and Analysis software thesis writing.
FEATURE HIGHLIGHTS:
- High-quality data visualization and plotting with few clicks
- Reliable and easy data analysis and statistics, no coding required
- Intuitive and fast computing with interactive notebooks
- Effortless data extraction from images
- Smooth data import and export to and from multiple formats
- Available for Windows, macOS, Linux and FreeBSD
5. SciDAVis
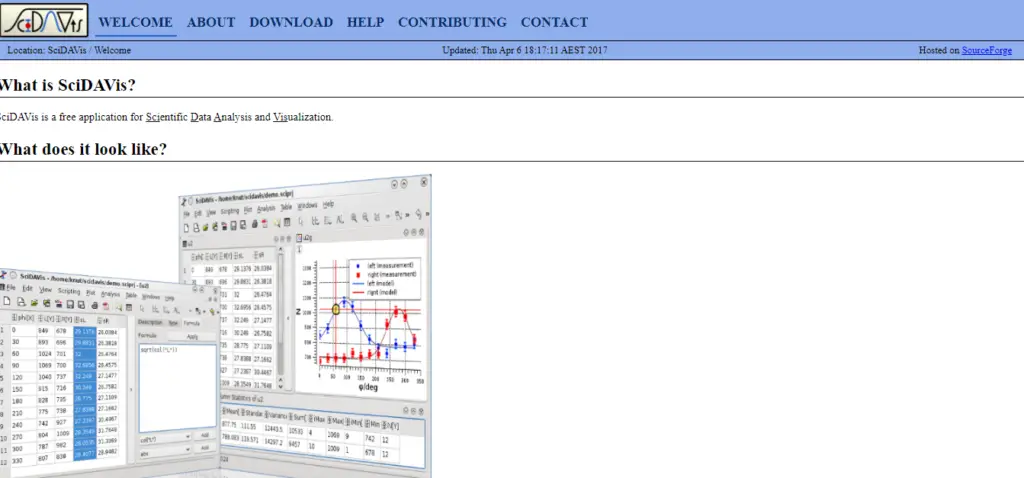
SciDAVis is a free interactive application aimed at data analysis and publication-quality plotting. It combines a shallow learning curve and an intuitive, easy-to-use graphical user interface with powerful features such as scriptability and extensibility. SciDAVis runs on GNU/Linux, Windows and MacOS X; possibly also on other platforms like *BSD, although this is untested.
FEATURE HIGHLIGHTS:
- Tables (2D data), matrices (3D data), graphs (2D or 3D plots) and notes (text notes or scripts) are gathered in a Project and can be organized using folders.
- Data for tables or matrices can be entered directly or imported from ASCII files.
- Cell values in tables can be computed using standard and special functions (and much more if you have Python installed). Each table cell can be assigned an individual formula.
- Multi-level undo/redo for tables and matrices.
- Many built-in analysis operations like column/row statistics, (de)convolution, FFT and FFT-based filters.
- Extensive support for fitting linear and nonlinear functions to the data, including multi-peak fitting.
- Publication-quality 2D plots of various types including symbols/lines, bars and pie charts which can be exported to a variety of formats (JPG, PNG, EPS, PDF, SVG and more).
Also Read: 10 Best Free Online Drawing Software

I love this post! I’m currently using R for my thesis and it’s been great. I’m definitely going to check out the listed software!